To Know Ourselves . . .. . . we have Statistics Canada ready to serve, with the 2016 Census count as of May 10, 2016. This…
Watching Population Change: The American ExperienceFrom the Washington Post Wonkblog: This is a mesmerizing little animation created by Bill McBride of Calculated Risk. It shows the distribution…
Colour CodeEric Fischer maps the top 40 US cities by race, using 2000 census data. Each color-coded dot represents 25 people:…
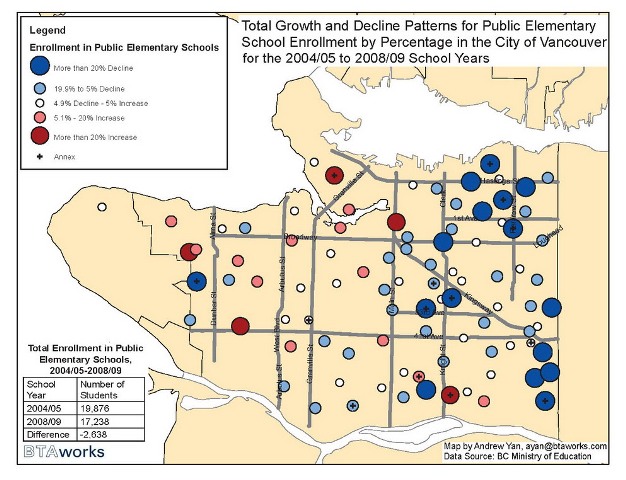
Missing ChildrenThe latest from Bing Thom’s home-grown R&D division, BTA Works. Blue indicates a decline in enrolment. Research reveals that since…
Dec. 19, 2022Vancouver’s “Dinosaurs Against Fossil Fuels” (DAFFS) Way Ahead of Their TimeSandy James Planner